Potty schedule at a glance
A heatmap of when your dog goes, by hour and day of the week, over the last three months.


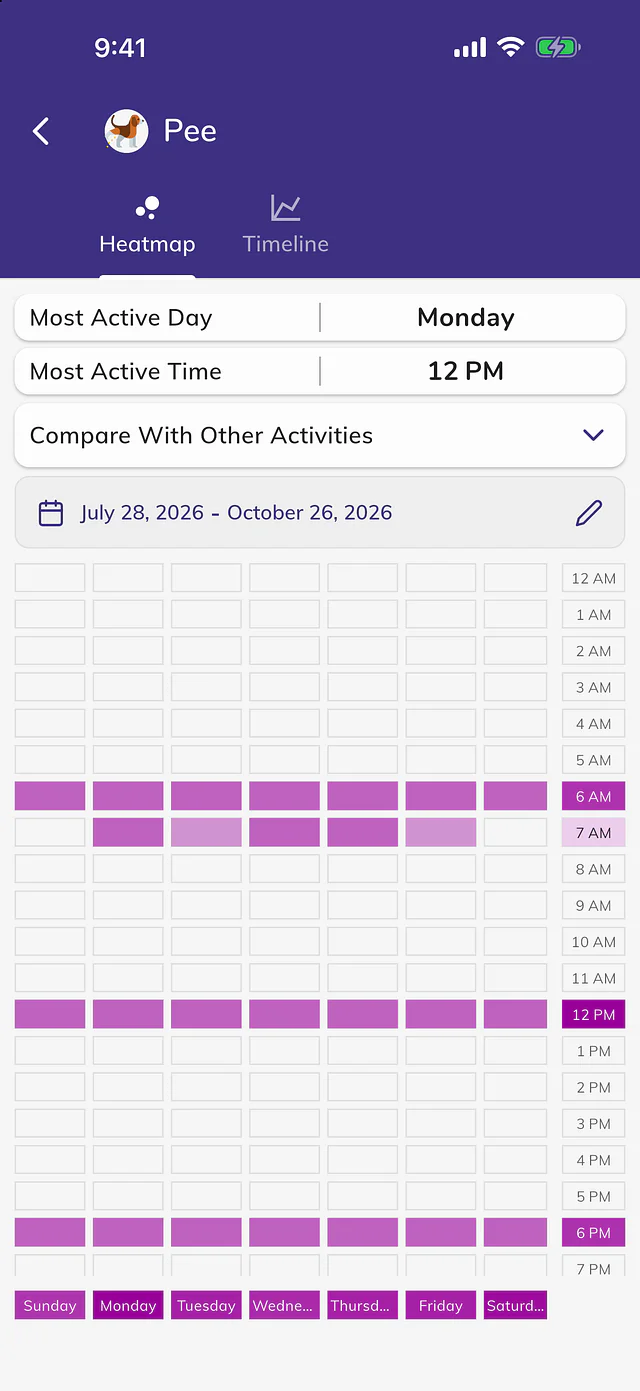
Progress turns the log into charts. The heatmap shows every hour of every day of the week, darker where an activity happens most, so a potty schedule shows up as clear bands at the same times each day.
It names the most active day and hour, compares one activity with another, and a timeline shows the same entries day by day.
Start free today
On iPhone, iPad, Android, Apple Watch and Wear OS.